
 As retail technology evolves, convenience store operators have the tools to turn sales figures into actionable information.
By Pat Pape, Contributing Editor.
Thanks to advanced technology, retailers can now collect data at the point of sale that tells them what is moving out of their stores, when it sells, who buys it and at what price. The challenge is how to best separate valuable data from curious facts.
Like many convenience chains, E-Z Stop Food Marts, with 22 outlets in east Tennessee, has made a substantial investment in hardware and software to collect scan data, and now the management team is learning how best to convert those numbers into actionable information that will benefit the operation.
“We’re in a state of transition right now,” said David Green, general manager for E-Z Stop. “For the past few years we’ve had our hands on raw data and the analysis was manual, but we have some new capabilities. For a long time, large chains, such as 7-Eleven and Circle K, have used a combination of syndicated data and their scan data to help create planograms and merchandise the stores, and now smaller companies are catching up.”
E-Z Stop relies on PDI for scan data solutions and is researching software that assists retailers with space management. This type of application allows users to create and manipulate store floor plans, layouts and comprehensive space information in color, 2-D and 3-D.
“We’re starting to use our scan data, in combination with other tools, to validate our existing sets and to make changes based on our findings,” Green said. “We hope to grow into a position in the future where we can draft planograms from scratch. Right now it’s a collaboration between our vendors and our own staff.”
Prior to collecting and analyzing scan data, convenience store operators depended on vendors to tell them what was selling in their stores. They often permitted vendors to stock merchandise on store shelves, adding and deleting products based on the vendor’s objectives. But with the right tools in place, operators are gathering their own proprietary sales data and it’s helping them yield impressive results.
“The vendors understand space management and are truly working in partnership with us,” Green said.
Sales Report Card
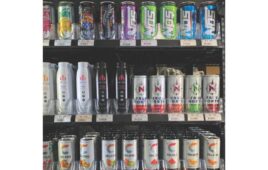
One area where scan data makes a major contribution is in analyzing the results of in-store promotions. E-Z Stop runs 30-50 promotions at any given time. “Out of those promotions, we’ll focus on seven,” said Green. “Those seven promotions all have the objective of putting more profit in the bank.”
To determine the outcome of an individual promotion, Green’s team will look at how well a product sold before, during and after the promotion and then compare the results to previous sales periods. “We also look to see if we’ve increased profitability in the category,” he said.
Currently, E-Z Stop is not doing market basket analysis, which is used to better understand the buying behavior of customers, determine the best location and promotions for merchandise inside the store and identify items that are typically purchased together.
“True market basket data will give us more detailed information than what we’re seeing right now,” said Donna Perkins, pricebook manager for E-Z Stop. “It will provide a better view of take rates on multipacks and by-item purchases. We’re not getting true market basket data now, but we’re very close.”
Many convenience chains with customer loyalty programs use scan data to discover what products loyal customers typically buy and determine how to better serve their needs. Using that information, one Southern operation discovered that members of its loyalty program spent significantly more during an average transaction than non-loyalty shoppers.
While E-Z Stop does not have a loyalty program at this time, Green is interested in using scan data to research that opportunity. “Actually, I’m interested in selling more items at their regular price,” he said. “And there are opportunities out there to use technology to drive more sales at the regular price.”
Learning Curve
To make the best use of scan data, an organization needs someone—or several people—to organize and analyze it and then determine how to best incorporate that information into the operation. At E-Z Stop, no single person is assigned this responsibility. Instead, everyone on staff is learning to be part of the process.
“There’s a lot of data, and I would love to have a staff of people who do nothing but analyze it,” said Green. “But with a chain my size, that’s not reasonable. We are educating everyone the best we can to understand what it means and how to use it. We’ve been working on growing in our sophistication and use of technology. I continuously expose my co-workers to these ideas and show them the science behind retail analysis. The more I put in front of them, the more capable they become.”
Since the first of the year, management has placed increased emphasis on understanding and using the collected data, and Green feels this focus has made his team more techno-savvy. “It’s a learning process,” he said. “We learned a lot from watching what the larger, successful retailers do, and we’ve learned a lot from watching other industries and how they use their data to make decisions.”
Understanding the Customer
According to the U.S. Department of Labor Statistics, the producer price index, which measures changes in wholesale prices, rose 1.6% in February. The cause was the food segment, which jumped 3.9%, the biggest monthly increase since November 1974. At the same time, volatile gasoline prices continued chewing away at consumers’ pocketbooks. E-Z Stop management knows it’s a tough time for shoppers, who have become more cost conscious after watching prices rise on staple items.
“We want to get more in touch with the customer,” Green said. “When we look at scan data, we’re trying to figure out what drives customer decisions and how we can attract them to more frequent visits and more expenditures in our stores.”
There are numerous tools on the market to help retailers with hundreds of locations collect and analyze scan data. There also are solutions for the small operator with only a couple of outlets, and some of those are priced on a per-store basis.
“There is no question that having the knowledge would benefit a retailer of any kind,” said Green. “We’ve made a lot of investment to have this capability. I don’t know how reasonable it would be (financially) for a small store owner.”
Despite the outlay in time, money and resources required to master mountains of scan data, Green believes there are tremendous opportunities for using the technology now and in the future.
“To excel in retail in today’s marketplace, you have to be a jack of all trades and master of a lot of things,” he said. “What interests me about scan data is the fact that it can drive decisions that touch every corner of the store and reach every aspect of our operation in terms of merchandising, our physical layouts, advertising and promotions and how we influence customer decisions. It can make you more of a market leader than a reactive organization.”