
 Ricker’s leads convenience stores with highest ratio of foot traffic per station.
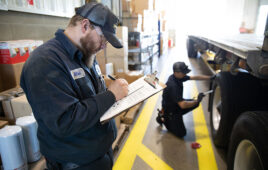
C-store visits are up and stations with a good cup of Joe are seeing even more customers, according to a recent study by Cuebiq and GasBuddy.
Cuebiq, a location intelligence company with the largest, most accurate location database in the U.S. and GasBuddy, the only smartphone app connecting nearly 70 million drivers with their Perfect Pit Stop, have conducted their second quarterly joint study examining foot traffic of GasBuddy users to convenience stores and gas stations across the U.S. in Q2 2017.
As the first footfall trend report series in the fuel and convenience store space, the analysis exemplifies how location intelligence can help this massive and rapidly growing industry understand consumer habits and behaviors.
Leveraging Cuebiq’s proprietary intelligence platform and data collection methodology, the companies analyzed anonymous geo-behavioral patterns of GasBuddy’s app users, which allowed them to gain insights into its users’ offline behavior such as frequency of station visits, fueling patterns, how long they spend at a location and brand loyalty, and offered recommendations to make these insights actionable for retailers. Given the competitive retail environment in the fuel and convenience store industry, it’s critical for retailers to understand customers, competitors and the best practices that drive people into physical stores.
Key study highlights include:
Individual visit frequency increased in Q2…
Across Q2, visit frequency increased, with the number of GasBuddies visiting gas stations and convenience stores once a week or more climbing from 48% to nearly 53%. According to a recent GasBuddy survey, 74% of respondents say they stop at stations and stores for something other than fuel. To capitalize on this momentum for the next quarter, retailers can take advantage of these more frequent trips by marketing their loyalty programs and other in-store promotions to make convenience stores a destination even for consumers who are not looking to fill up.
…and dwell time decreased
Though individual visit frequency increased, the number of customers spending more than 2-3 minutes at any location (the time it takes to fill a tank of gas) decreased from 72% to 68%. For retailers looking to capture customers beyond the average 2-3 minutes it takes to fill a gas tank, well-timed and targeted mobile promotions that hit customers in the “last mile” of their journey to the gas station or c-store. Signage at the pump that clearly reflects your in-store offerings can also help bring customers inside.
June was a busy month for gas stations
The last week of June captured the most gas station visits this quarter, with GasBuddy users gearing up for the July 4 holiday. The weeks of June 4 and June 11 ranked second and third. However, Memorial Day weekend came in ninth in Q2.
Good coffee drives foot traffic!
On average in Q2, stations received 16.67% of their daily traffic between the hours of 5 a.m. and 10 a.m. Stations with excellent coffee ratings in the GasBuddy app receive 18% of their daily traffic during these hours, which is relatively 12.5% more than stations with below average coffee ratings.
Ricker’s captures the top spot—again
For the second-consecutive quarter, Indiana-based gas station and convenience store chain Ricker’s took the top spot with the highest ratio of footfall per station, capturing more than 4x the industry average in visits.
Methodology
From April 1 to June 30, 2017, GasBuddy and Cuebiq analyzed location visit data at more than 100 fuel and convenience store brands across the United States, equaling nearly 22.6 million trips, to understand foot traffic trends, provide geo-behavioral and consumer insights and identify the impact of key factors such as the customer experience, ratings and holiday travel on POI visits.
For the full report: http://business.gasbuddy.com/wp-content/uploads/2017/07/FootTrafficReportQ2.pdf